Analyzing your research data must be done methodically and consistently in order to draw valid conclusions.
What is data?
Simply put, data is information that is collected systematically and purposefully and examined in order to make decisions. Typically we think of data as quantitative – numerical data or data that can be transformed into statistical information to explore a research question. However, researchers also use qualitative data, collected through observation of behaviours or verbal interactions or reports. The authority of qualitative research depends on the rigour with which this data is collected, organized and analyzed.
Researchers analyze the body of data that they collect in order to discover trends and to uncover what is known and what is not known.
Analyzing Quantitative Data
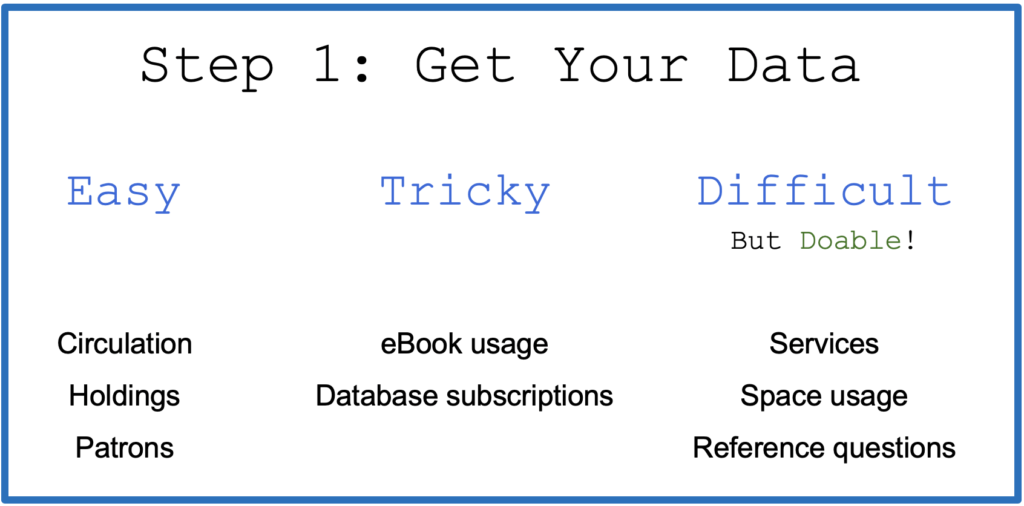
Analyzing quantitative data is the process of turning raw data into usable information. The researcher is looking for the frequency of variables (i.e., how frequently do students in Grade 7 borrow books from the library) and the difference between variables (i.e., looking for differences between specific groups, like the different classes in Grade 7, the boys and girls in Grade 7, etc).
Most integrated library systems (ILS) provide detailed data on all aspects of the library collection and usage, and allow you to filter that data in a variety of ways, including by date range. Similar reports are available for subscription databases and eBook access. It is worthwhile to explore the various reports available to determine how they might serve your research purpose.

Collecting and organizing data about spaces and services (i.e., instructional sessions, space usage) requires a degree of personal organization. For example, it is very useful to spend some time on the first of every month recording all of the data from the previous month. This will make it easier later to compare trends over time. If you find this too time-consuming and once a month is not reasonable, try every term or semester.
It is important to organize and tidy your data. Keeping a running tally in a spreadsheet with multiple tabs keeps all of the data in one place for easy comparison and also allows slightly different structure between tabs. The tabs can be identified by data type in order to make it easier to navigate

Analyzing Qualitative Data
Making sense of qualitative data focuses on thematic analysis. It uses inductive reasoning – identifying patterns that emerge from the many pieces of specific information that are gathered through observations, interviews, focus groups, etc.. This type of thematic analysis is commonly used in applied research, such as research in education and in librarianship.
The first step in dealing with the large body of data that you have collected is to reduce it into something usable and to organize. Reduce by filtering out data that is not useful for the purpose (i.e., parts of the interview or focus group interaction that got completely off topic). Another important aspect of qualitative data analysis is being aware of how your own beliefs about a topic can influence the way you analyze and interpret data. Qualitative researchers take care to be transparent in their processes, keeping notes so that they can back up their conclusions with evidence from the data.
Coding Qualitative Data
Coding is the process of identifying patterns, themes and trends and then organizing them into coherent categories. Coding makes sense of qualitative data.
When coding, the researcher applies a symbol or short note to a section of text in the transcript to make an observation. Codes are assigned meaning and then further organized into categories. During the coding process themes emerge. As part of this process codes and categories can be revisited and further refined. The researcher documents this process carefully, taking notes about how the process supports the analytic process. The notes will help the researcher explain how they reached their conclusions.
The first step in analyzing qualitative data is transcribing it. This can be very time-consuming. Making audio recording of interviews is very helpful. Be sure that participants are aware that they are being recorded, and receive informed consent (See the Research Ethics page for more information).
Literal transcription may not be possible within the context of time constraints, however the transcripts should at least consist of detailed notes. There are computer programs for transcribing that are useful for large studies and researchers experienced in their use. Manual transcription remains the most viable option for practitioner research. Using highlighting, note-taking, colour coding and other techniques, the researcher is able to identify patterns, themes and trends.
The companion website to the book The Coding Manual for Qualitative Researchers (Saldaña, 2016) provides useful and practical resources.
Validity and Reliability
It is extremely important that researchers do everything that they can, through the research approach and methodology as well as data collection and analysis, to ensure the validity and reliability of their research.
Validity
The validity of research depends on how it is designed and executed, and the degree to which it accurately measures what it claims to measure. Choices about the research approach, methodology, data collection and data analysis influence the validity of the research. The researcher understands the scope of the work, and avoids making inappropriate transfer claims. For example, the results of research into one library’s makerspace is valid information as it relates to that school, but not necessarily for all libraries.
Reliability
The reliability of your research depends on whether your research techniques and the techniques that you use to collect and analyze data are consistent and stable. Basically, if the same procedures were replicated by another researcher, would they produce the same findings. Some considerations to ensure reliability are:
Data Collection: The quantitative data that you have collected is directly relevant to the research question. In qualitative research, reduce the risk of inconsistency in data collection by controlling the conditions under which data is collected. For example, the researcher can reduce the risk of participants in a focus group providing erroneous or disingenuous responses because for whatever reason they feel unable to speak honestly and freely.
Researcher Bias: It is important that researchers look for the accurate answer to their research question rather than the answer that they want to find. Careful consideration of research design and methods collecting data is extremely important in this context. So is the rigour with which data is analyzed. It is important for the researcher to remain as objective as possible.
Sample Size and Suitability: For empirical research, the number of people participating as subjects of the research and the degree to which the sample group as a whole is representative of the larger population being studied will affect the reliability of the research.
Visualizing Data

Data visualization is the process of representing data sets and patterns such as frequency, differences and trends. Quantitative data is often represented through graphs and charts. Visual representations make it easier to process complex data and make sense of the information it represents.
The real benefit of a visualization is that it provides a lot of data in a condensed form. Even one simple graph can tell a story.
Many data collection tools include visual reports. Survey tools such as SurveyMonkey and Google Forms produce useful graphic representations of the data that you gather. Many online tools that we use provide detailed data and visual representations of that data. It is now very easy to gather statistics and visual representations of that data about everything from usage of the school library website to data about the impact of videos on your YouTube channel and Twitter account.
Data visualization expert Georgia Lupi cautions against using visual representations to over-simplify data through visual representation, and in the process miss nuances, particularly about the context in which the data was gathered.
 |  |  |  |  |
 |  |  |  |  |
